
LinkedIn Post Analytics: How to Find and Read Every Metric (2026)
Click the chart icon under any LinkedIn post and you get impressions, reactions, comments and clicks, with no explanation of which ones matter. This guide shows where to find analytics for your posts, profile and company page, what each metric tells you, and what a good engagement rate actually is.
To see analytics for a LinkedIn post, click the impression count (the small chart icon) under your post, or click the three dots on the post and choose "View post analytics." To see all your posts together, go to your profile and open the Analytics section. Company pages have their own Analytics tab, which needs admin access.
The catch is what you find there: a wall of numbers (impressions, reactions, comments, reposts, clicks) with no explanation of what any of them actually mean, or which ones matter. The one worth tracking closely is engagement rate, and two large studies put a normal rate at roughly 2% to 5%.
This guide covers all of it: where the analytics live for your posts, your profile and your company page, what each number actually tells you, and the one mistake almost everyone makes when reading them. Where a figure appears here, the study it came from is named next to it. Where a widely repeated number turned out to have nothing behind it, it isn't in this post.
The useful way to think about your analytics is not as a scoreboard but as a diagnostic. Each metric points at a different part of the same funnel:
- People are seeing the post but not engaging: the hook isn't landing, or the topic isn't relevant to whoever is being shown it.
- People are engaging but not visiting your profile: the content is entertaining but not credible enough to make anyone curious about who wrote it.
- People are visiting your profile but not following: the profile doesn't communicate what you're worth following for.
That is the whole job of the dashboard: showing you where the conversation is breaking down.
Where to Find Your LinkedIn Analytics
LinkedIn doesn't make this obvious, and where the analytics live depends on whether you're looking at a personal profile or a company page. They are completely separate systems. Your personal posts will never appear in your company page's analytics, and vice versa.
| Personal Profile | Company Page | |
|---|---|---|
| Desktop entry | Profile picture → View Profile → Analytics section | Work icon → select the page → Analytics tab |
| Mobile entry | Profile picture (top left) → Analytics section | Work icon → select the page → Analytics menu |
| What you need | Nothing to enable, but you have to have published something | Admin or Analyst access |
| Key metrics | Profile views, post impressions, search appearances, follower growth | Visitors, followers, content performance, competitors, leads |
| How far back it goes | Rolling 90 days on a free account | Rolling 365 days |
| Demographic depth | Limited | Full breakdown by industry, job function, seniority, location, company size |
Personal profile analytics on desktop
Click your profile picture in the top right, select "View Profile," then look for the Analytics section just below your bio. You'll see three tabs: Profile Views, Post Impressions and Search Appearances. Click "Show all analytics" for the full dashboard.
There is no toggle to switch on first. LinkedIn retired Creator Mode in March 2024 and made the tools it used to gate available to every eligible profile by default, so the creator analytics that track follower growth, content performance over time and engagement trends now sit inside that same Analytics section. If you can't see analytics at all, the usual reason is that you haven't published a post yet.
Personal profile analytics on mobile
Tap your profile picture in the top left of the app, scroll to the Analytics section, then tap "Show all analytics." The mobile view is thinner than desktop but it's enough for a quick check on recent posts and profile views.
Individual post analytics
Click the chart icon underneath any post you've published, or the three dots in its top right corner, then "View post analytics." That gives you impressions, members reached, reactions, comments, shares and clicks for that one post.
Company page analytics
Company page analytics need admin access. Click the Work icon in the top right, select the page, then click "Analytics" in the top navigation. You'll see tabs for Visitors, Followers, Content and Competitors. On mobile, tap the Work icon, select the page, then Analytics from the menu.
Page analytics are considerably richer than personal profile analytics, with full demographic breakdowns of your followers, visitor trends over time, and CSV export, none of which a personal profile gets.
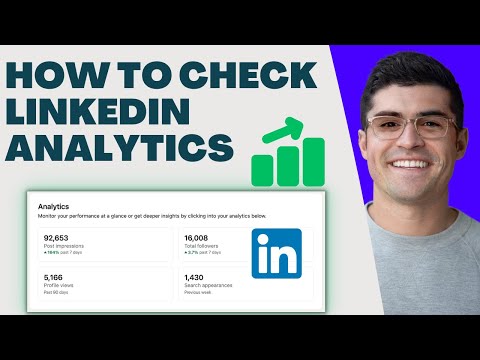
If you'd rather watch someone click through all of this than read it, the video below is a click-by-click tour of where everything lives.
The Core Metrics, Explained Simply
Impressions: how many times your post appeared on someone's screen. The commonly cited rule is that an impression counts when at least half your post is visible for roughly 300 milliseconds, about the time it takes to scroll past without stopping. LinkedIn doesn't publish a threshold for organic posts. That's worth knowing, because it means impressions measure exposure, not attention. A post can rack up impressions from people who never actually read it.
Members reached: how many unique people saw your post, as opposed to impressions, which count every appearance, including repeat views from the same person. If a post shows 3,000 impressions and 1,800 members reached, that gap means some people came back to it more than once. That is genuinely a good sign, not a discrepancy to worry about. The reverse pattern is the one to watch: very high impressions against low reach means the same small group is seeing your content over and over, which is not the same thing as growth.
Reactions, comments, shares: the visible engagement signals. Worth knowing: not all of them carry equal weight with LinkedIn's algorithm. Comments and shares tend to matter more for how widely your post gets distributed than reactions do, even though all three show up as "engagement" in your dashboard. Reactions are the lowest-effort signal available; a share is someone putting their own name behind your content in front of their network.
Clicks: anyone who tapped "see more," clicked a link, or clicked through to your profile. This is the clearest signal that someone wanted more than a passive scroll-past.
Two format-specific metrics worth knowing about
Most of the dashboard treats every post the same, but two formats give you something extra. For video, the number that matters isn't views. It's average watch time and completion rate, which tell you whether people stayed. For documents and carousels, impressions only tell you the cover was shown. Clicks are the better sign that someone opened the document and started swiping, so compare clicks against impressions to see whether your cover slide is doing its job.
Engagement Rate: The One Number Worth Tracking Closely
Engagement rate is the metric that actually tells you something useful in one glance: what percentage of the people who saw your post did something about it.
Engagement Rate = (Reactions + Comments + Shares + Clicks) ÷ Impressions × 100
Say one post gets 10,000 impressions and 50 engagements, and another gets 1,000 impressions and the same 50 engagements. The first is a 0.5% engagement rate and the second is 5%. The second post performed roughly ten times better despite looking, on the dashboard's headline number, ten times smaller.
State your denominator. That formula divides by impressions. Plenty of sources divide by reach instead, and some divide by follower count. Same post, same interactions, three different answers, which is exactly why the published "average engagement rate" figures disagree so violently. Whichever you pick, use the same one every time, or your own trend line is meaningless.
What is a good LinkedIn engagement rate?
This is the question everyone asks, and the honest answer has two halves. Here is the number, and then here is why the number matters less than you'd like it to.
The number. Social Insider's 2026 benchmark study, built on 1.3 million posts from 16,645 LinkedIn business pages published between January 2024 and December 2025, puts the platform-wide average engagement rate at 5.20%, calculated against impressions. AuthoredUp's analysis of 481,623 posts published between September 2025 and February 2026, filtered to posts with real reach of 100 or more impressions, with statistical outliers above 12% removed, puts the median at 2.38% for personal profiles and 2.60% for company pages. Both studies are real, both are published, and they disagree by more than a factor of two. The gap is methodology, not error: means against medians, business pages against personal profiles, unfiltered datasets against ones that strip out low-reach posts and viral outliers.
Why your own baseline matters more. Even the right platform average is the wrong benchmark for you, because engagement rate moves with account size. AuthoredUp's follower-band breakdown of 372,812 personal-profile posts shows a median engagement rate of 2.56% for accounts under 1,000 followers, 2.68% at 1,001–5,000, and 2.53% at 5,001–20,000. That is essentially flat. Then it falls: 1.78% at 50,001–100,000 followers and 1.53% above that. So an account with 200 followers and an account with 200,000 followers are being measured on different scales, and neither of them is well described by a single platform-wide figure.
Which gives you a workable answer rather than a false one. If your engagement rate sits somewhere between roughly 2% and 5%, you are inside the range that two independent large-scale studies both describe as normal. Above that, something is working. Below 1% consistently, something needs looking at, usually the hook, the topic, or the fit between what you write and who follows you. But the comparison that actually tells you anything is your own rate against your own last five to ten posts, at your own follower count. Chasing someone else's number is how people talk themselves out of content that was working.
A high engagement rate can still be hiding a problem
Engagement rate counts interactions. It cannot tell the difference between twenty comments saying "Great post!" and two comments asking a real follow-up question. A post can show a spectacular rate and have started no conversation at all.
So read the comments, not just the count. If people are sharing their own experience, disagreeing with you, or tagging a colleague, the content did something. If it's all politeness, the number is flattering you. Ending with a specific question instead of "thoughts?" is usually the fix.
Why Reading Analytics the Day You Post Can Mislead You
LinkedIn posts don't finish performing on day one. Distribution is no longer settled in the first hour the way it used to be. Content can keep gaining impressions and engagement for days or weeks after publishing, which means a post that looks flat the day you check it can end up being one of your stronger performers later, and a post that looked strong immediately can plateau. Checking too early is one of the most common ways people misread their own data.
Wait at least a week before you draw a conclusion about a single post. If you want the pattern rather than the post, wait a month.
Impressions Aren't the Whole Story
It's tempting to treat impressions as the scoreboard. Resist that. A post that reaches 800 people who are genuinely your audience is doing more work for you than a post that reaches 8,000 people who scroll past without a second thought. This is the same principle behind why a small, engaged following can outperform a much larger, passive one. The number of people who saw your post matters far less than whether the right people did.
That's worth internalising early, because it changes what you look for: not "did this reach a lot of people," but "did this reach people who matter, and did they do something about it."
The good news is that LinkedIn will tell you who those people were. That's what audience analytics are for, and it's the part of the dashboard most people never open.
Audience Analytics: Whether the Right People Are Watching
Thousands of followers mean nothing if they're the wrong people. Audience analytics turn the principle above into something you can check.
LinkedIn breaks your audience down by industry, job function, seniority, location and company size. That matters because it's the only way to catch the failure mode that no engagement number will show you: if you're targeting enterprise buyers and most of your followers are students and freelancers, the strategy isn't working, regardless of how good the engagement rate looks.
Where to find audience demographics
For company pages: Analytics → Followers tab, which gives you the full breakdown. For personal profiles it's much thinner. LinkedIn shows follower growth over time, but detailed demographic breakdowns are a company page or third-party tool feature.
Industry and job function: are you reaching the right roles?
Industry tells you which sectors your followers work in. Job function tells you what they actually do. A marketing consultant going after CMOs in SaaS should be seeing "Marketing" and "Technology" at the top. Seeing "Education" and "Non-Profit" instead doesn't mean burning the strategy down. It means testing content that speaks more directly to the people worth attracting, and checking again next month.
Seniority: decision-makers or entry-level?
Seniority splits your audience into entry-level, mid-level, senior, director, VP, C-suite and owner/partner. If you sell high-ticket services, you want director-level and above. An audience that skews entry-level usually means the content is too tactical. Step-by-step how-tos attract people doing the work; strategic pieces attract the people buying it.
Location and company size
Location tells you where your followers are. If you only serve clients in one country and most of your audience is somewhere else, that's a mismatch worth naming. Company size tells you whether your followers are at startups, mid-market or enterprises. And if you're selling to enterprises while your audience works at ten-person companies, the messaging is reaching the wrong segment no matter how well it performs.
Follower growth trends
Spikes in follower growth usually trace back to a single post. When you see one, go and find out which. Flat or declining growth means either the content isn't landing or the posting isn't consistent, and the fix is different in each case.
Profile Analytics: Your Leading Indicators
Post analytics are lagging. Profile analytics are leading. They tell you whether your content is making people curious enough to find out who you are.
Profile views
Profile views count how many people visited your profile in a given window. On a free account that window is the last 90 days; LinkedIn Premium extends the viewer history to 365 days. A spike after a post takes off is normal. What matters more is steady growth over time.
The diagnostic here is the useful bit: posts generating plenty of engagement but no corresponding lift in profile views usually mean the content is entertaining but not credible. People enjoyed it. They didn't think "who is this?"
Search appearances
Search appearances show how often your profile turned up in LinkedIn search results, along with the keywords that triggered it. If you're positioning yourself as, say, a LinkedIn strategist, you want to see "LinkedIn strategist" and its neighbours in that keyword list. If you don't, your headline and About section aren't saying what you think they're saying.
This number builds slowly and compounds. Consistent content around a narrow set of topics trains LinkedIn to associate your profile with those topics and surface it more often, which is the same mechanism that decides who your posts get shown to in the first place.
Post impressions over time
This is your total post impressions across the last 90 days, a macro view rather than a per-post one. An upward trend is the goal. Flat or falling means it's time to test different formats, topics or cadence. If timing is the variable you want to test, we've covered the best time to post on LinkedIn separately.
Company Page Analytics
Page analytics are the fuller picture: visitor data, follower demographics, content performance and competitor benchmarking, split across four tabs.
Visitors: who's checking out the page?
The Visitors tab shows how many people came to the page, where they came from, and their demographics. Traffic source is the part to read. Mostly search means your SEO is doing the work. Mostly from posts means your content is. Mostly direct means people are typing your name in on purpose, which is the best of the three.
Followers: growth rate, not headcount
The Followers tab breaks your page audience down the same way personal audience analytics do, and it's worth tracking growth rate rather than total count. As pure arithmetic: a page with 1,000 followers growing 10% a month passes a stagnant page of 10,000 in under about two years. Total followers is a snapshot. Growth rate is momentum.
Content: the underrated metric
The Content tab gives impressions, reach, engagement rate and clicks for every page post. Sort by engagement rate rather than impressions and look at your top three for a common thread: format, topic, hook, length.
The genuinely underrated number in here is follower versus non-follower engagement. If most of your engagement comes from non-followers, your content is escaping your existing audience and reaching new people. If almost all of it comes from followers, your reach isn't expanding. You're talking to the same room.
Competitors: read the small print
The Competitors tab lets you benchmark follower count, growth rate and engagement rate against other pages. This one changed recently and most guides haven't caught up: as of 15 October 2025, a free company page can track a single competitor. Comparing against nine, plus seeing trending posts from three of them, now requires a paid Premium Company Page subscription.
Either way, the point isn't to obsess over rivals. It's context. If your engagement rate is 2% and comparable pages sit at 4%, there's room. If it's the other way round, something you're doing is working and deserves more of your time.
The Metrics That Actually Matter, and What They're For
Not every number deserves your attention, and which ones do depends on why you're posting in the first place. Before you open the dashboard, decide which of these you're actually trying to move:
- Brand awareness → follower growth rate and post impressions over time.
- Lead generation → click-through rate and profile visits that follow a specific post.
- Thought leadership → comment quality and shares, not reaction counts.
- Community building → engagement consistency across posts rather than any single peak.
That mapping is our recommendation rather than a measured finding, but it does the one thing a dashboard can't: it stops you optimising for a number that has nothing to do with why you're here.
Engagement rate over raw impressions
Impressions tell you how many times your content was shown. Engagement rate tells you how many people cared enough to do something. One is a distribution decision LinkedIn made. The other is a verdict your readers reached.
Comment quality over comment quantity
Ten "Great post!" comments don't mean much. One comment saying "this changed how I think about X" means a great deal. LinkedIn's dashboard can't measure the difference. You can, in about fifteen seconds, and it's the most informative fifteen seconds in the whole review.
Profile visits from posts over total profile views
Total profile views include people who found you through search, through a comment, or at random. Visits that spike immediately after a post are different, because they signal intent. Watch for profile-view spikes that line up with specific posts, and write more of those.
Metrics you can safely ignore
Total impressions with no engagement-rate context. Follower count with no growth rate. Reactions with no comments or shares. Profile views with no idea where they came from. These all feel good to look at and none of them tells you what to do next.
A 10-Minute Weekly Analytics Review
Checking analytics daily creates noise, and you end up reacting to fluctuations that mean nothing. Ignoring them entirely means missing the patterns. A short weekly review solves both: sort last week's posts by engagement rate, compare the median with the week before, check whether profile views or followers jumped after a particular post, and pick one thing to change next week.
Before your first review, write down your starting point: current follower count, median engagement rate over your last ten posts, and profile views for the last month. Without a baseline you can't tell improvement from noise.
For the full workflow, including how to export your data, run a content audit, choose content pillars and build a monthly report, see our guide on how to use LinkedIn analytics to plan your content.
The three habits underneath all of this
If you take nothing else from this guide, take these:
- Check your engagement rate, not just your impression count, and compare it to your own last 5–10 posts rather than a platform-wide average.
- Wait at least a week before judging a post's performance. Checking on day one alone will mislead you on a meaningful share of your posts.
- Notice which posts pull real comments, not just reactions. Comments are a stronger signal of genuine resonance, and they're the metric most worth paying attention to when deciding what to write more of.
Where LinkedIn's Native Analytics Stop
Native analytics are fine for the basics and genuinely limited past that, in ways worth knowing before you build a habit on top of them.
A personal profile holds a rolling 90 days; a company page holds 365. You can export creator analytics and single-post analytics to Excel, but the export only covers the numbers. Tagging posts by topic and format, and tracking engagement rate month over month, means maintaining your own spreadsheet. And there's no competitor data at all for personal profiles. That's a company page feature, and since October 2025 mostly a paid one.
None of that is a scandal. It's just the shape of the tool, and it's why anyone posting seriously ends up keeping their own record.
ContentIn's LinkedIn analytics bring your post metrics together in one place instead of one post at a time, alongside the AI Ghostwriter that turns what you learn into the next post in your own voice. You can see what's included on the pricing page.
"I tested out 3 tools in December to up my LI game: Taplio, AuthoredUp and ContentIn, and yours is by far my favorite. Your AI Assistant is the best AI I've seen so far for LI content creation."
Pilar Suquilvide, Head of Client Account Management
Frequently Asked Questions
What is a good LinkedIn engagement rate?
Social Insider's 2026 benchmark study of 1.3 million posts puts the platform average at 5.20% against impressions; AuthoredUp's filtered analysis of 481,623 posts puts the median at 2.38% for personal profiles and 2.60% for company pages. Both are credible and they differ because they measure differently. Practically: between about 2% and 5% is normal, and engagement rate falls at large follower counts, so your own recent history at your own size is a far better benchmark than either figure.
What's the difference between impressions and members reached?
Impressions count every time your post appeared on a screen, including repeat views from the same person. Members reached counts each unique person only once. Both numbers are visible in your post analytics.
How long should I wait before judging how a post performed?
At least a week. LinkedIn posts can keep accumulating impressions and engagement for days or weeks after publishing, so a same-day read only tells part of the story.
Do comments matter more than likes?
Generally, yes. Comments and shares tend to carry more weight in how widely LinkedIn distributes a post than reactions alone, even though all three appear together as "engagement" in your dashboard.
Where do I find my LinkedIn analytics?
Personal profile: click your profile picture, go to "View Profile," scroll to the Analytics section, then "Show all analytics." Company page: click the Work icon, select the page, then "Analytics" in the top navigation. Individual posts: the chart icon underneath the post.
Why are my impressions dropping?
Impressions fluctuate, and the more useful question is whether your engagement rate is dropping with them. If impressions are down but engagement rate is steady, you're fine. When impressions fall persistently it's usually one of three things: posting frequency dropped, LinkedIn changed how it distributes content, or recent posts aren't earning enough early engagement to trigger wider distribution. Check your own frequency first. It's the only one of the three you control.
Can I see who viewed my posts?
No. LinkedIn shows individual profile viewers (unless they're browsing privately), but for posts you only ever get aggregate data.
Why don't I have access to certain analytics features?
Some features are company-page only: competitor benchmarking and detailed visitor demographics among them. Follower growth tracking and content performance trends used to sit behind Creator Mode, but LinkedIn retired that toggle in March 2024 and they now apply to every eligible personal profile. If you see nothing at all on a personal profile, you probably haven't posted yet.
My analytics look wrong or incomplete. What now?
Four common causes. On a personal profile, check you're on your own profile via Me → View Profile, since the Analytics section is only visible to you. On a company page, confirm you have Admin or Analyst access rather than plain Member. "Not enough data" on demographic breakdowns usually means the page hasn't got enough followers yet. And LinkedIn's reporting can lag a day or two, so a number that looks wrong this morning may well be right tomorrow.
Which post format performs best?
That's a distribution question rather than an analytics one, and the numbers are worth reading properly. We've broken down engagement rate by format, with the datasets named, in our guide to how the LinkedIn algorithm works now. If you want the impressions metric itself explained in more depth, see what impressions are on LinkedIn.
The Short Version
Impressions tell you about distribution. Engagement rate tells you about resonance. Profile visits tell you about intent. Audience demographics tell you whether any of it is reaching the people you actually want.
Open your analytics now. Sort your last ten posts by engagement rate. Look at the top one and work out what made it work: the hook, the format, the topic. Then do that again this week. That's the entire discipline.
Create Engaging LinkedIn Content
Use ContentIn's AI Ghostwriter to write posts that resonate with your audience and build your personal brand effortlessly.